Elder Trading Copilot
A context-aware trading assistant — interactive backtest dashboard plus a RAG-powered chatbot — built around Alexander Elder's Triple Screen system.
- Type
- Web
- Role
- Solo
- Status
- Active
- Tech
- Python Streamlit LangChain FAISS Plotly pandas yfinance HuggingFace Embeddings Groq (Llama 3.3 / 3.1 / Mixtral) OpenAI GPT-4o-mini
- Started
- Mar 2026
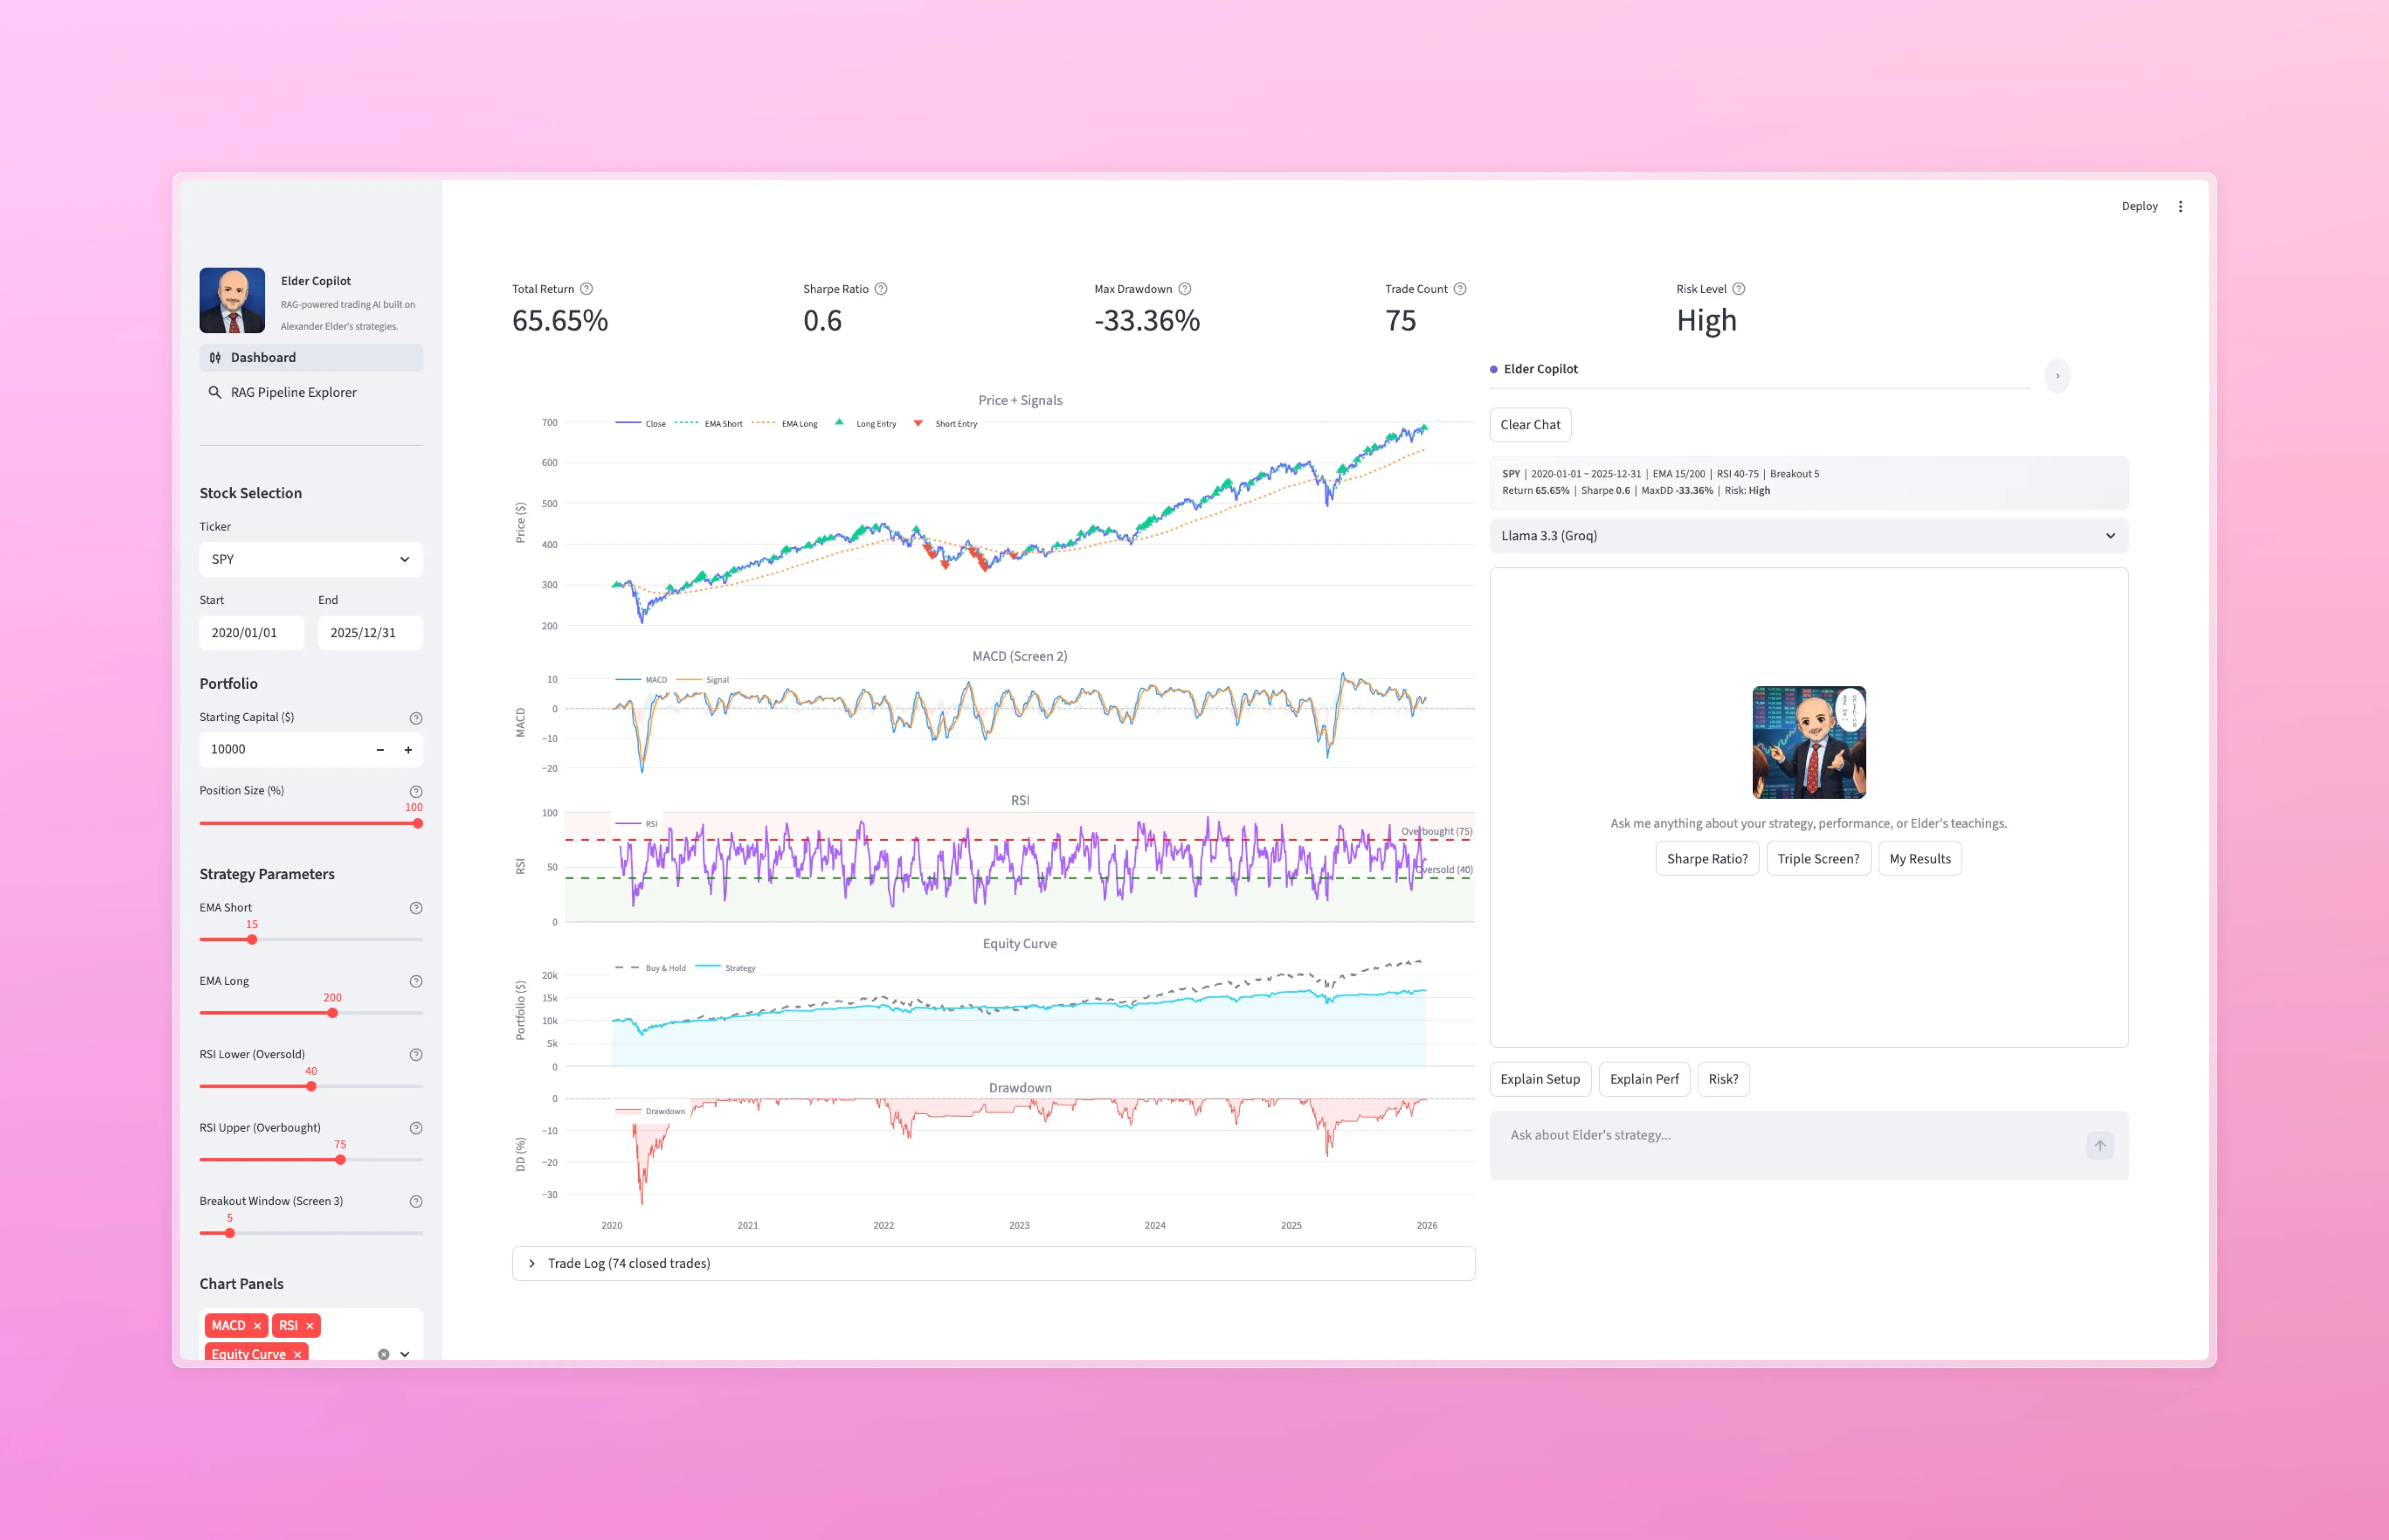
An interactive backtesting dashboard fused with a RAG-powered chatbot that answers questions about whatever you’re currently looking at. The strategy layer implements a simplified version of Alexander Elder’s Triple Screen Trading System; the chat layer answers questions grounded in 894 QA pairs extracted from Elder’s books and video lectures.
Features
- Interactive backtest dashboard — adjust strategy parameters (EMA windows, RSI thresholds, breakout window), starting capital, and position sizing via sidebar controls. Charts and metrics update in real time.
- Five linked charts — price with buy/sell signals, MACD histogram (Screen 2), RSI with overbought/oversold zones, equity curve vs buy-and-hold, and drawdown curve, all sharing a synchronized x-axis.
- Context-aware RAG chatbot — an embedded copilot panel with streaming word-by-word output that reads the current dashboard state (ticker, parameters, backtest results, risk level) and injects it into every prompt.
- Multi-model support — switch between four LLMs (Llama 3.3 70B, Llama 3.1 8B, Mixtral 8x7B via Groq; GPT-4o-mini via OpenAI) and three embedding models (bge-small, bge-base, all-MiniLM-L6-v2) with a single dropdown.
- 894-entry knowledge base — QA pairs extracted from Elder’s books and video lectures, embedded and indexed in FAISS for sub-millisecond retrieval.
- RAG pipeline explorer — a dedicated page that visualizes every stage of the pipeline: query embedding, chunk retrieval with metadata, assembled prompt, and timed LLM generation.
- Pipeline compare — side-by-side comparison for embedding models, LLMs, and top-k values, so you can see how each configuration affects retrieval quality and response content.
- Trade log — expandable table showing every closed trade with entry/exit dates, prices, shares, P&L, return percentage, days held, plus summary statistics.
Architecture
+-----------------------------------------------------------+
|                       Streamlit UI                         |
|  +---------------------------+----------------------+      |
|  |  Dashboard (60%)          |  Copilot Panel (40%) |      |
|  |                           |                      |      |
|  |  Metric cards             |  Embed + LLM select  |      |
|  |  Price / MACD / RSI /     |  Context summary bar |      |
|  |  Equity / Drawdown        |  Chat (streaming)    |      |
|  |  Trade log                |  Quick-ask buttons   |      |
|  +-------------+-------------+--------+-------------+      |
|                |                      |                    |
+----------------+----------------------+--------------------+
                 |                      |
                 v                      v
       +-------------------+   +----------------------+
       |  Backtest Engine  |   |   RAG Pipeline       |
       |                   |   |                      |
       |  yfinance data    |   |  Select embedding    |
       |  EMA / RSI / MACD |   |  Load FAISS index    |
       |  Triple Screen    |   |  Embed query         |
       |  Position sizing  |   |  Top-k retrieval     |
       |  Metrics calc     |   |  Build prompt        |
       +---------+---------+   +----------+-----------+
                 |                        |
                 v                        v
       +-------------------+   +----------------------+
       |  Context Builder  |-->|  Generation Layer    |
       |                   |   |                      |
       |  ticker / dates   |   |  Llama 3.3 70B       |
       |  strategy params  |   |  Llama 3.1 8B        |
       |  backtest metrics |   |  Mixtral 8x7B        |
       |  risk level       |   |  GPT-4o-mini         |
       +-------------------+   +----------------------+
Stack
| Layer | Technology | Purpose |
|---|---|---|
| UI | Streamlit multi-page | Dashboard, chatbot panel, pipeline explorer, compare page |
| Market data | yfinance | Free historical OHLCV |
| Indicators | pandas / numpy | EMA, RSI, MACD (computed from scratch) |
| Charts | Plotly | Interactive linked 5-chart layout |
| Embeddings | BAAI bge-small-en-v1.5 / bge-base-en-v1.5 / sentence-transformers MiniLM | Three options, pre-built FAISS indexes |
| Vector store | FAISS IndexFlatL2 | Exact L2 nearest-neighbor |
| LLMs | Llama 3.3 70B / 3.1 8B / Mixtral 8x7B (Groq) · GPT-4o-mini (OpenAI) | Four model options with different speed/quality tradeoffs |
| Orchestration | LangChain | Unified embedding + vector store abstractions |
Notable bits
- Context injection done right — the copilot isn’t a generic RAG chatbot. Every message pulls the current dashboard state (ticker, parameter snapshot, backtest metrics, risk level) and prepends it to the system prompt, so “is this a buy signal?” is answered against this specific chart, not a vacuum.
- Multi-model parity through one abstraction — embedding models and LLMs are both swappable from a single dropdown. The pipeline compare page makes it easy to A/B test retrieval vs generation quality independently.
- Fragments-based UI — Streamlit fragments keep chart re-renders scoped so the copilot panel doesn’t blink every time a slider moves.